Stop arguing about losses. Start measuring them.
DOVA gives CI leaders a real plant baseline, a living Pareto of losses, and before/after proof for every initiative. Your next kaizen starts with data, not a week of data-gathering.
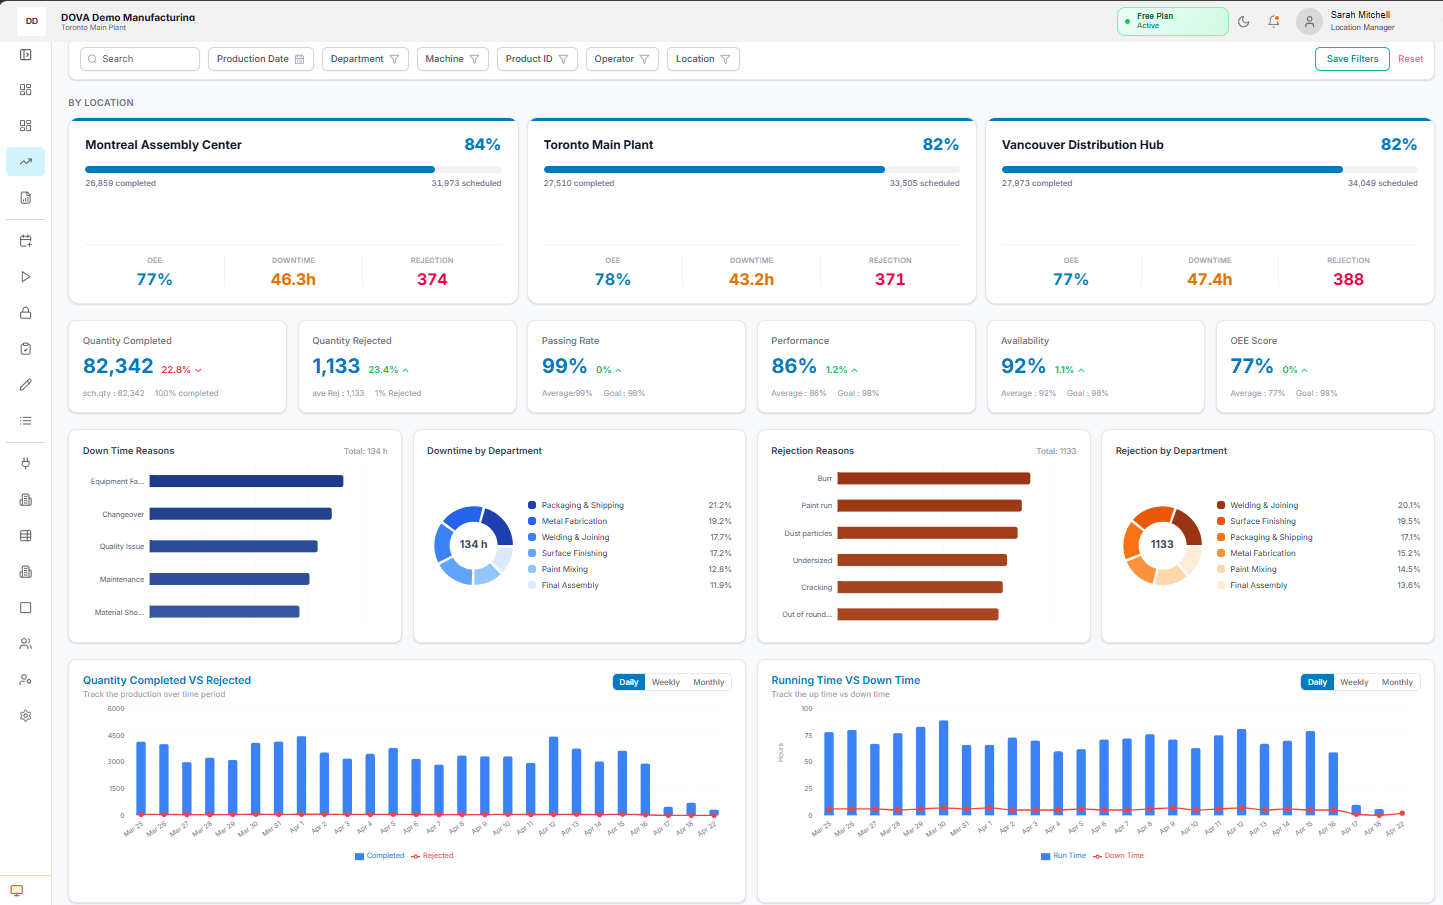
Downtime Pareto and rejection reasons — the view you actually need for a kaizen.
The pain you know
Improvement projects die in the "before/after" gap
You ran the kaizen. Did it stick? Without a shared baseline, arguments about impact replace evidence. Gains drift back to where they started within a quarter.
Losses are opinion, not data
"I think line 3 is slow" turns into a week-long study to confirm what the floor already knew. The biggest losses rarely announce themselves.
Your A3s are typed from memory
Production data lives in spreadsheets, paper logs, and someone's phone. Every review meeting starts with an hour of data-cleaning.
What DOVA does for you
A Pareto of losses, updated live
Downtime reasons and rejection reasons are captured at the station and rolled into department and plant-level Paretos. The top three causes are always current — not last month's view.
Before/after proof on every initiative
Compare any two periods. See OEE, availability, performance, and quality shift — for a machine, a department, or the whole plant. Your kaizen either moved the line or it didn't, and the data shows it.
Hidden capacity, found
Automated OEE per machine surfaces the quiet losers — the lines where availability is fine but performance is silently eating your throughput. Target the fix where the return is real.
Numbers your review meetings can trust
Every figure on every chart traces back to an event captured at the source. Export a department view or screenshot it straight into your A3. No parallel spreadsheet required.
Start your next kaizen with data.
Book a demo and we'll walk through the Pareto and before/after views against a sample plant set up to look like yours.