Run the plant from one screen.
DOVA gives plant managers live OEE, real-time downtime reasons, and multi-location visibility without the month-end report cycle. Stop waiting for spreadsheets to tell you what already happened.
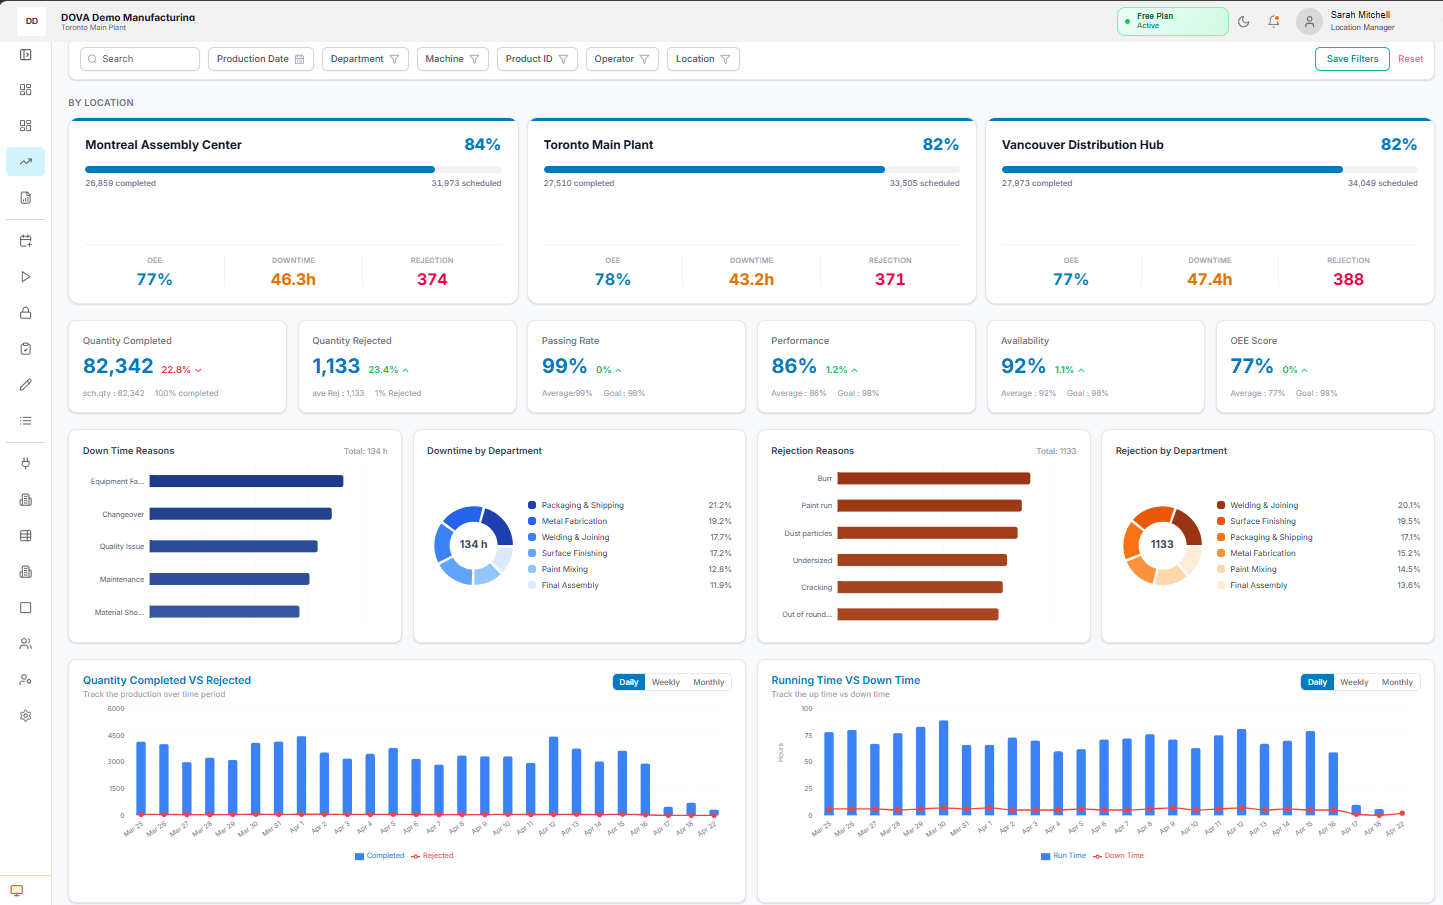
The Production KPI dashboard — what a plant manager sees on Monday morning.
Your day-to-day, right now
You find out about problems too late
By the time the shift-end report lands, the recovery window is already closed. Yesterday's downtime spike is today's missed delivery date.
OEE numbers you don't trust
Numbers get typed from paper into Excel, summed weekly, and interpreted differently by each supervisor. You stop making decisions with them.
You walk the floor to get answers
Every question — what's running, who's behind, why did that line stop — costs you a 20-minute walk. And half the answers change before you're back at your desk.
What DOVA does for you
Every line, every shift, in one view
The Production KPI dashboard shows live OEE, rejection rate, availability, and performance across every machine — computed continuously, not end-of-shift.
Multi-location visibility
If you run more than one plant, each location gets its own card with OEE and downtime at a glance. Drill into a single site without switching accounts.
Real downtime reasons, captured live
Operators log downtime at the station with plant-specific reason codes. You see the cause in minutes, not hours — and you see the pattern across weeks.
Quality data that speaks the same language
Rejections and rework are captured with reason codes at inspection. Trend charts surface the top three quality losses for every department automatically.
Set up in one day, not twelve months
Upload a schedule, add your locations and departments, plug in the TV displays. Operators are entering data on day one. No year-long consulting engagement.
See what it looks like for your plant.
Book a 30-minute demo and we'll walk through the dashboard with a plant set up to look like yours. Or run the numbers yourself with the ROI calculator.